
The Waterbury Times|Published Nov 20, 2025
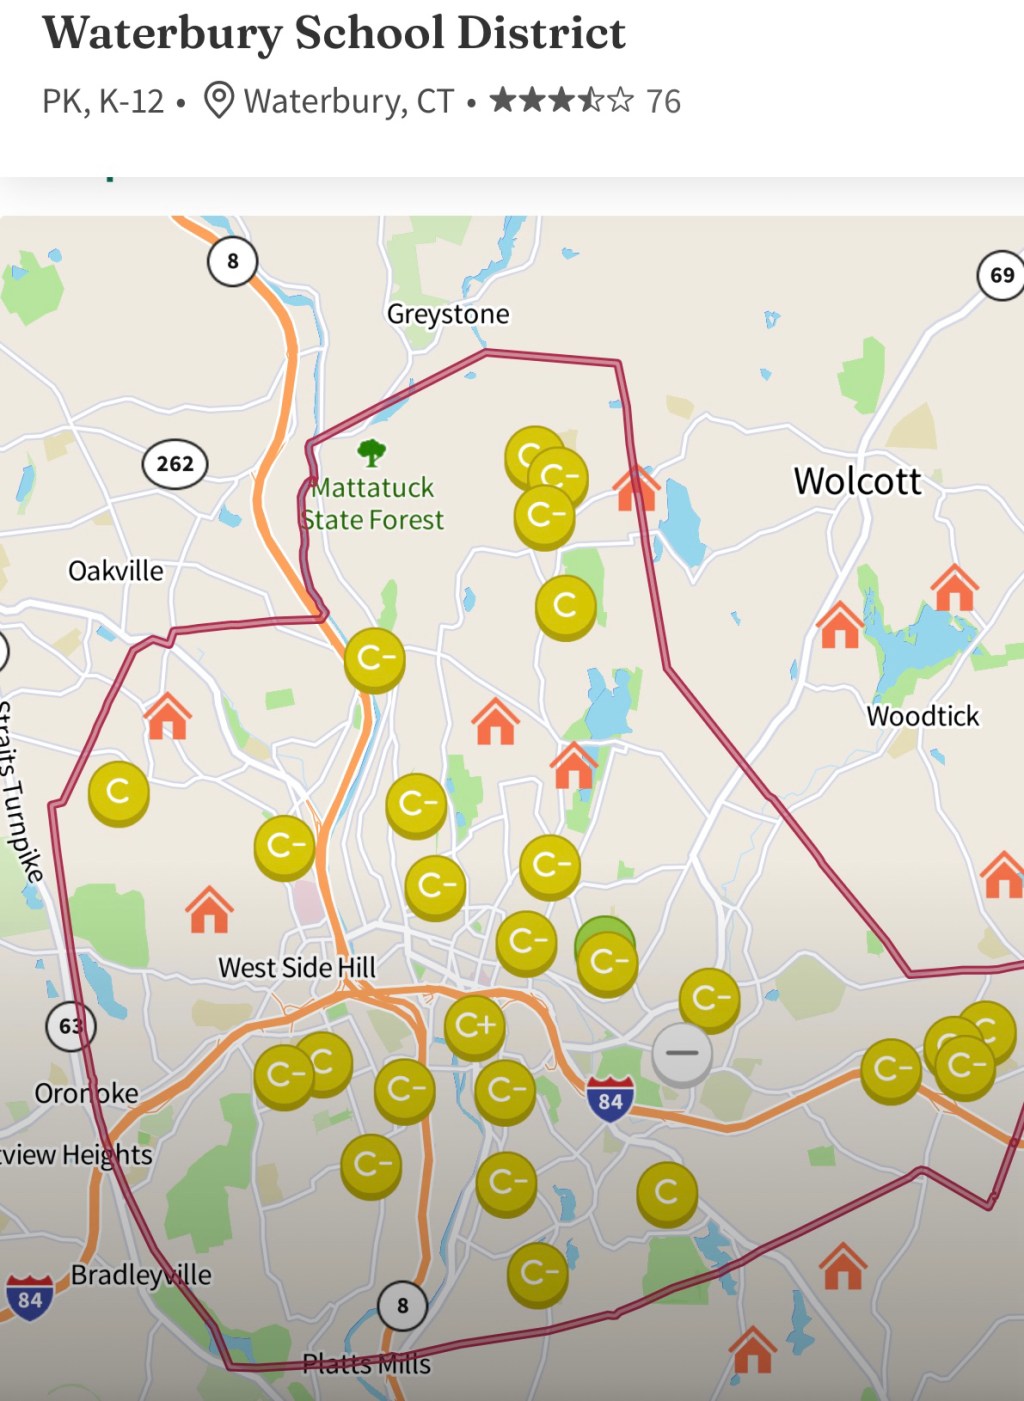
Waterbury, CT- The Waterbury Public School District is one of Connecticut’s largest and most diverse public school systems, serving nearly 19,000 students from pre-K through grade 12. As we approach 2026 the district faces both the challenges and opportunities that come with educating a large urban population.
This evergreen breakdown analyzes the latest available district data—including academics, demographics, resources, and student life—to give families, community members, policymakers, and educators a clear, long-term picture of where Waterbury stands and where it’s heading.
Data- courtesy Niche.com
Academic Performance: A District in Transition
Niche Grade: C-
Academic performance remains the district’s greatest hurdle.
Key Indicators
- State test proficiency (Reading): 24%
- State test proficiency (Math): 12%
- Average SAT score: 1040 (Math 510, Verbal 530)
- Average ACT score: 22
Although the proficiency numbers are below state averages, Waterbury has made strides in graduation outcomes, maintaining an 81% graduation rate—a sign that many students persist through challenges to finish high school.
What This Means
Waterbury’s academic landscape reflects the realities of a diverse, high-need district. The lower proficiency scores highlight the need for stronger early literacy programs, more math intervention, greater access to tutoring, and continued investment in special education and multilingual support.
Still, the district has the foundation to grow: a reasonable student-to-teacher ratio, growing partnerships, and a committed teaching staff.
Teachers & Administration: Strength in Stability
- Teacher Grade: A-
- Administration: B+
Despite academic challenges, students and parents consistently rate Waterbury’s teachers highly. Families report strong relationships with educators and school leaders, noting improved communication and better support systems.
This aligns with Waterbury’s ongoing push to strengthen recruitment, professional development, and leadership training.
Student Diversity: One of the Most Diverse Districts in Connecticut
Waterbury is a multicultural, multilingual city—and its schools reflect that reality.
Student Population Breakdown
- Hispanic/Latino: 62.5%
- African American: 21.1%
- White: 10.1%
- Multiracial: 4.2%
- Asian: 1.6%
- Native American: 0.5%
This level of diversity—combined with a near 50/50 gender split—creates a rich cultural environment that few districts can match. Waterbury’s classrooms expose students to a wide range of backgrounds and experiences, preparing them for a global workforce.
College & Career Preparation
Niche Grade: B-
While SAT/ACT scores indicate room for improvement, Waterbury students benefit from expanding college-readiness supports, including:
- Dual-enrollment opportunities
- Career pathways
- After-school tutoring
- New STEM and workforce development partnerships
The district’s challenge will be scaling these opportunities district-wide so that all students—regardless of school—receive equal access.
Student Life: Activities, Sports & Facilities
- Clubs & Activities: B
- Sports: B-
- Food: B-
- Resources & Facilities: B
Waterbury continues investing in facility upgrades, athletic fields, technology improvements, and expanded after-school programming. These elements are critical for student engagement, especially in a large district.
What the Numbers Really Say About Waterbury Schools
Waterbury Public Schools sit at the intersection of enormous potential and significant challenge. The district teaches nearly 19,000 students, many from historically underserved communities. Its diversity, dedicated educators, and improving graduation rates show promise—while academic proficiency scores underscore the need for sustained investment and reform.
The story of Waterbury’s education system is not one of failure—it is one of ongoing transformation.
For families, educators, and policymakers, understanding this data is essential. These numbers serve as a roadmap for where progress is happening and where more support is needed.
Waterbury BOE Commissioner Addresses Chronic Busing Challenges and New Tracking Tools
Why This Matters for Waterbury
Education shapes everything—from public safety to economic development to the future labor force. Strong schools build strong neighborhoods.
This evergreen Waterbury Times data review will be updated as new reports emerge, ensuring the community has a clear, accurate, and unbiased picture of Waterbury’s educational landscape.
The above data was collected by Niche-
About Niche: How the Data Is Collected
The statistics and grades referenced in this report come from Niche, a nationally recognized data and research platform that analyzes schools, colleges, and communities across the United States. Niche is used by millions of families each year to make decisions about education and housing, and its rankings are considered among the most comprehensive in the country.
How Niche Gathers Its Data
Niche uses a multi-source methodology that combines:
1. Publicly Available Government Data
Niche pulls official education statistics from trusted national and state sources, including:
- The U.S. Department of Education
- The National Center for Education Statistics (NCES)
- State Departments of Education
- Civil Rights Data Collection (CRDC)
This includes enrollment, demographics, test scores, graduation rates, and student-teacher ratios.
2. School District–Provided Information
Districts self-report data on:
- Programs offered
- Extracurricular activities
- Facilities
- Academic supports
- Staff resources
This helps Niche capture information beyond state test outcomes.
Waterbury Education News — Schools, Busing, BOE Updates & Parent Alerts
3. Student, Teacher & Parent Surveys
Niche supplements hard numbers with real community experience by collecting:
- Anonymous student reviews
- Teacher and staff feedback
- Parent satisfaction surveys
These survey responses influence grades in areas such as:
- Administration
- School culture
- Clubs & activities
- Food
- Overall experience
4. Proprietary Niche Analysis
Niche uses weighting formulas to convert raw data—test scores, SAT averages, graduation rates—into final grades ranging from A+ to D-.
Each factor carries different weight depending on the category.
For example:
- Academic grades are heavily tied to state test scores
- Teacher grades emphasize teacher experience and student-teacher ratios
- Diversity scores rely on demographic entropy calculations
Why Niche Data Matters
Because Niche blends official state data with community insight, it provides one of the most holistic evaluations of a school district available. Families, real estate agents, and national research organizations rely on Niche to compare districts across states and track long-term trends.
For a district as large and diverse as Waterbury, the Niche profile offers a clear, standardized snapshot that’s useful for parents, policymakers, and taxpayers. It shows:
- Performance strengths
- Areas needing investment
- Student demographics
- Comparative rankings versus similar CT districts
This transparency is vital for community accountability and future planning.

Leave a reply to Waterbury Weekly Digest- The Week that Was- (Nov 16-22) – The Waterbury Times- Waterbury,CT Local News Cancel reply